Press Releases
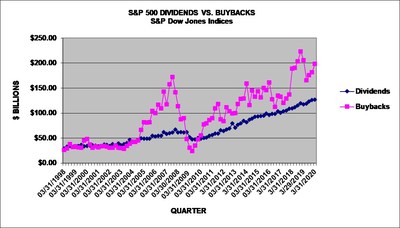
NEW YORK, June 25, 2020 /PRNewswire/ -- S&P Dow Jones Indices ("S&P DJI") announced today that preliminary Q1 2020 S&P 500® stock buybacks, or share repurchases, were $198.7 billion – a 9.4% increase over Q4 2019's $181.6 billion, but down 3.4% from Q1 2019's $205.81 billion.
Historical data on S&P 500 buybacks are available at www.spdji.com/indices/equity/sp-500.
Key Takeaways:
- Companies posted the third consecutive quarter of increased buyback expenditures, returning to the $200 billion range, as the U.S. economic impact of the COVID-19 was just starting. For the quarter, S&P 500 companies spent $198.7 billion on buybacks, up 9.4% from their Q4 2019 $181.6 billion mark, but down 3.4% from last year's Q1 2019 expenditure of $205.8 billion.
- For the 12-month March 2020 period, companies spent $721.6 billion, down 12.3% from the record 12-month March 2019's $823.2 billion. The cumulative rolling four quarters of repurchases continued to impact EPS as 19.3% of the issues reduced share counts by at least 4% year-over-year, down from Q4 2019's 20.7% and 24.9% in Q1 2019.
- S&P 500 Q1 2020 dividends set a quarterly record, increasing to $127.0 billion, up 8.2% from Q1 2019's $117.3 billion; for the 12-month period, dividends set a record with $495.1 billion, up 6.6% from the corresponding prior period's $464.4 billion.
- Total shareholder return of buybacks and dividends for the quarter came in at $325.7 billion, the second largest in history (Q4 2018 was $342.8 billion), up 5.8% from the Q4 2019 period expenditure of $307.9 billion and up 0.8%% from the $323.1 billion reported for Q1 2019.
- Total shareholder return for the 12-month March 2020 period declined to $1.217 trillion from March 2019's record $1.288 trillion.
- Buybacks continued to be top heavy, as the top 20 issues represented 46.7% of all buybacks, down from Q4 2019's 55.0%.
"Companies went out with a bang in Q1 2020 with respect to buybacks, returning to the $200 billion range for the quarter, reminiscent of the tax-inspired record-setting buying spree of 2018," said Howard Silverblatt, Senior Index Analyst at S&P Dow Jones Indices. "While the expenditures for Q1 2020 were in line with the estimates at year-end 2019, expectations have significantly fallen since then due to the COVID-19 impact, as companies suspended their forward buybacks. But for Q1, they were all-in."
Remainer of 2020 Outlook:
"COVID-19 has significantly changed the Q2 2020 and forward buyback landscape, as companies have moved quickly to protect their liquidity via reduced and suspended buybacks and dividends," said Silverblatt, who noted that all corporations will be cautious about buybacks due to economic and political concerns. For the remainder of 2020:
- Buyback priorities remain low among the new corporate short-term priorities:
- Controlling liquidity
- Reopening operations, with ongoing evaluations of:
- Customer base
- Business environment
- Employee and social responsibilities
- As businesses reopen and the economy picks ups, companies will need to address prior actions as well as initiate new procedures and policies to function in the new environment:
- Reinstate buybacks related to covering employee options
- Discretionary buybacks which reduce share count and increase EPS may be slower to return and subject to regulatory and political issues
- Operational changes including:
- Reorganization to address employee location needs
- Operational changes to address any shift in customer base and cycles
- Potential corporate changes with respect to M&A and divestiture
Q1 2020 GICS® Sector Analysis:
Information Technology continued to lead in buyback expenditures, spending $59.4 billion for the quarter, up 12.8% from the prior quarters $52.4 billion, but down 13.0% from the Q1 2019 $68.0 billion level. On a percentage basis, the sector represented 29.8% of all buybacks, up from the prior quarters 28.9%. For the 12-month March 2020 period, the group spent $216.0 billion, representing 29.9% of the buybacks, down 23.7% from the corresponding 2019 period's $283.1 billion expenditure, which represented 34.4% of the buybacks.
Financials remained second to Information Technology, as they decreased expenditures 7.2% to $46.6 billion, down from last quarter's $50.2 billion, representing 23.5% of all buybacks, down from 27.7% in Q4 2019. For the one-year period, the group spent $182.5 billion, representing 25.3% of all buybacks, up 14.7% from their 2019 expenditure of $159.1 billion, which represented 19.3% of the buybacks. For Q2 2020, over three-quarters of the sector have suspended their buybacks.
Consumer Staples buybacks decreased 44.0% to $5.3 billion from last quarter's $9.4 billion, as the 12-month period decreased 18.5% to $29.3 billion from $36.0 billion in the 2019 period.
Issues:
The five issues with the highest total buybacks for Q1 2020 are:
- Apple (AAPL) continued to lead, spending $18.8 billion in Q1 2020, ranking 7th in S&P 500 history, as the level was down 15.1% from their Q4 2019 $22.1 billion expenditure and down 21.2% from their Q1 2019 $23.8 billion. For the 12-month period, Apple has spent $76.6 billion on buybacks, up from 2018's $75.1 billion. Over the five-year period, they have spent $276.0 billion and $360.6 billion over the ten-year period.
- Alphabet (GOOG): $8.5 billion for Q1 20120, up from $6.1 billion for Q4 2019; for the 12-months ending in March 2020 they spent $23.7 billion versus $9.9 billion.
- Microsoft (MSFT): $7.1 billion for Q1 2020, up from $5.2 billion in Q4 2019; for the 12-months ending in March 2020 they spent $21.8 billion versus $17.3 billion.
- JP Morgan (JPM): $6.5 billion for Q1 2020, down from their $6.8 billion Q4 2019 expenditure; for the 12-months ending in March 2020 they spent $25.4 billion versus $20.4 billion.
- Bank of America (BAC): $6.4 billion for Q1 2020, down from the $7.7 billion spent in Q4 2019; for the 12-months ending in March 2020 they spent $28.2 billion versus $21.5 billion.
For more information about S&P Dow Jones Indices, please visit www.spdji.com.
S&P Dow Jones Indices | ||||||||
S&P 500, $ U.S. BILLIONS | (preliminary and estimates in bold) | |||||||
PERIOD | MARKET | OPERATING | AS REPORTED | DIVIDEND & | ||||
VALUE | EARNINGS | EARNINGS | DIVIDENDS | BUYBACKS | DIVIDEND | BUYBACK | BUYBACK | |
$ BILLIONS | $ BILLIONS | $ BILLIONS | $ BILLIONS | $ BILLIONS | YIELD | YIELD | YIELD | |
12 Mo Mar,'20 | $21,424 | $1,149.84 | $964.88 | $495.13 | $721.65 | 2.31% | 3.37% | 5.68% |
12 Mo Mar,19 | $23,619 | $1,286.96 | $1,129.97 | $464.46 | $823.17 | 1.97% | 3.49% | 5.45% |
2019 | $26,760 | $1,304.59 | $1,158.72 | $485.48 | $728.74 | 1.81% | 2.72% | 4.54% |
2018 | $21,027 | $1,281.66 | $1,119.43 | $456.31 | $806.41 | 2.17% | 3.84% | 6.01% |
2017 | $22,821 | $1,066.00 | $940.86 | $419.77 | $519.40 | 1.84% | 2.28% | 4.12% |
2016 | $19,268 | $919.85 | $818.55 | $397.21 | $536.38 | 2.06% | 2.78% | 4.85% |
3/31/2020 | $21,424 | $161.64 | $98.48 | $126.98 | $198.72 | 2.31% | 3.37% | 5.68% |
12/31/2019 | $26,760 | $324.35 | $294.78 | $126.35 | $181.58 | 1.81% | 2.72% | 4.54% |
9/30/2019 | $24,707 | $330.42 | $282.12 | $123.12 | $175.89 | 1.94% | 3.12% | 5.06% |
6/28/2019 | $24,423 | $333.26 | $290.00 | $118.68 | $165.46 | 1.93% | 3.27% | 5.20% |
3/29/2019 | $23,619 | $316.56 | $291.82 | $117.33 | $205.81 | 1.97% | 3.49% | 5.45% |
12/31/2018 | $21,027 | $293.82 | $242.91 | $119.81 | $222.98 | 2.17% | 3.84% | 6.01% |
9/30/2018 | $24,579 | $349.04 | $306.70 | $115.72 | $203.76 | 1.81% | 2.93% | 4.75% |
6/30/2018 | $23,036 | $327.53 | $288.55 | $111.60 | $190.62 | 1.89% | 2.80% | 4.69% |
3/29/2018 | $22,496 | $311.26 | $281.28 | $109.18 | $189.05 | 1.90% | 2.56% | 4.46% |
12/29/2017 | $22,821 | $288.93 | $230.12 | $109.46 | $136.97 | 1.84% | 2.28% | 4.12% |
9/29/2017 | $21,579 | $268.35 | $243.68 | $105.45 | $129.17 | 1.92% | 2.40% | 4.32% |
6/30/2017 | $20,762 | $261.39 | $231.40 | $104.01 | $120.11 | 1.96% | 2.41% | 4.37% |
3/31/2017 | $20,276 | $247.32 | $235.65 | $100.86 | $133.15 | 1.98% | 2.51% | 4.49% |
12/31/2016 | $19,268 | $240.11 | $207.93 | $103.82 | $135.29 | 2.06% | 2.78% | 4.85% |
9/30/2016 | $18,742 | $247.98 | $219.46 | $98.43 | $112.20 | 2.10% | 2.92% | 5.01% |
6/30/2016 | $18,193 | $222.77 | $201.79 | $98.30 | $127.50 | 2.14% | 3.22% | 5.36% |
S&P Dow Jones Indices | |||||||||
S&P 500 SECTOR BUYBACKS | |||||||||
SECTOR $ MILLIONS | Q1,'20 | Q4,'19 | Q1,'19 | 12MoMar,'20 | 12MoMar,'19 | 5-YEARS | 10-YEARS | Q4,'18 | Q2,'09 |
(high) | ( low) | ||||||||
Consumer Discretionary | $16,087 | $16,620 | $17,721 | $66,843 | $85,716 | $417,144 | $763,982 | $25,652 | $2,350 |
Consumer Staples | $5,278 | $9,429 | $9,786 | $29,330 | $35,978 | $200,853 | $434,920 | $9,588 | $4,013 |
Energy | $3,861 | $5,025 | $4,294 | $18,318 | $24,606 | $81,249 | $267,578 | $8,698 | $5,343 |
Financials | $46,637 | $50,232 | $42,845 | $182,477 | $159,097 | $676,231 | $947,931 | $45,641 | $1,170 |
Healthcare | $20,807 | $20,041 | $30,749 | $73,922 | $103,808 | $415,356 | $723,084 | $31,336 | $4,699 |
Industrials | $20,736 | $10,218 | $19,426 | $62,102 | $81,038 | $349,482 | $580,921 | $23,026 | $1,681 |
Information Technology | $59,138 | $52,432 | $67,986 | $215,999 | $283,088 | $916,168 | $1,453,129 | $61,298 | $4,757 |
Materials | $4,551 | $3,117 | $4,771 | $15,488 | $16,880 | $60,027 | $120,009 | $5,857 | $159 |
Real Estate | $1,320 | $573 | $409 | $3,142 | $3,293 | $11,922 | $11,922 | $1,480 | |
Communication Services | $20,002 | $13,687 | $6,345 | $51,848 | $26,412 | $80,481 | $116,587 | $9,556 | $13 |
Utilities | $303 | $211 | $1,479 | $2,180 | $3,251 | $8,760 | $18,153 | $850 | $10 |
TOTAL | $198,722 | $181,583 | $205,811 | $721,649 | $823,168 | $3,217,673 | $5,438,216 | $222,980 | $24,195 |
SECTOR BUYBACK MAKEUP % | Q1,'20 | Q4,'19 | Q1,'19 | 12MoMar,'20 | 12MoMar,'19 | 5-YEARS | 10-YEARS | Q4,'18 | Q2,'09 |
Consumer Discretionary | 8.10% | 9.15% | 8.61% | 9.26% | 10.41% | 12.96% | 14.05% | 11.50% | 9.71% |
Consumer Staples | 2.66% | 5.19% | 4.75% | 4.06% | 4.37% | 6.24% | 8.00% | 4.30% | 16.59% |
Energy | 1.94% | 2.77% | 2.09% | 2.54% | 2.99% | 2.53% | 4.92% | 3.90% | 22.08% |
Financials | 23.47% | 27.66% | 20.82% | 25.29% | 19.33% | 21.02% | 17.43% | 20.47% | 4.84% |
Healthcare | 10.47% | 11.04% | 14.94% | 10.24% | 12.61% | 12.91% | 13.30% | 14.05% | 19.42% |
Industrials | 10.43% | 5.63% | 9.44% | 8.61% | 9.84% | 10.86% | 10.68% | 10.33% | 6.95% |
Information Technology | 29.76% | 28.88% | 33.03% | 29.93% | 34.39% | 28.47% | 26.72% | 27.49% | 19.66% |
Materials | 2.29% | 1.72% | 2.32% | 2.15% | 2.05% | 1.87% | 2.21% | 2.63% | 0.66% |
Real Estate | 0.66% | 0.32% | 0.20% | 0.44% | 0.40% | 0.37% | 0.22% | 0.66% | 0.00% |
Telecommunication Services | 10.07% | 7.54% | 3.08% | 7.18% | 3.21% | 2.50% | 2.14% | 4.29% | 0.05% |
Utilities | 0.15% | 0.12% | 0.72% | 0.30% | 0.39% | 0.27% | 0.33% | 0.38% | 0.04% |
TOTAL | 100.00% | 100.00% | 100.00% | 100.00% | 100.00% | 100.00% | 100.00% | 100.00% | 100.00% |
S&P Dow Jones Indices | |||||||||
S&P 500 20 LARGEST Q1 2020 BUYBACKS, $ MILLIONS | |||||||||
Company | Ticker | Sector | Q1 2020 | Q4 2019 | 12-Months | 12-Months | 5-Year | 10-Year | Indicated |
Buybacks | Buybacks | Mar,'20 | Mar,'19 | Buybacks | Buybacks | Dividend | |||
$ Million | $ Million | $ Million | $ Million | $ Million | $ Million | $ Million | |||
Apple | AAPL | Information Technology | $18,761 | $22,085 | $76,635 | $75,149 | $276,035 | $360,633 | $15,504 |
Alphabet | GOOGL | Communication Services | $8,496 | $6,098 | $23,867 | $9,927 | $46,286 | $47,107 | $0 |
Microsoft | MSFT | Information Technology | $7,059 | $5,206 | $21,810 | $17,272 | $79,477 | $122,740 | $15,563 |
JPMorgan Chase | JPM | Financials | $6,517 | $6,751 | $25,427 | $20,403 | $78,709 | $103,673 | $11,291 |
Bank of America | BAC | Financials | $6,362 | $7,748 | $28,243 | $21,499 | $74,900 | $79,795 | $7,196 |
AT&T | T | Communication Services | $5,463 | $2,008 | $7,691 | $653 | $9,733 | $37,130 | $15,194 |
Intel | INTC | Information Technology | $4,229 | $3,523 | $15,322 | $11,346 | $37,846 | $73,394 | $5,742 |
eBay | EBAY | Consumer Discretionary | $4,037 | $1,042 | $7,727 | $4,059 | $18,687 | $27,551 | $554 |
Oracle | ORCL | Information Technology | $4,004 | $5,036 | $20,860 | $35,307 | $79,439 | $113,633 | $4,775 |
Wells Fargo | WFC | Financials | $3,713 | $7,386 | $23,464 | $22,712 | $74,528 | $98,277 | $9,481 |
Citigroup | C | Financials | $3,331 | $0 | $11,773 | $11,887 | $56,229 | $61,089 | $4,454 |
Visa | V | Information Technology | $3,141 | $2,517 | $9,942 | $7,782 | $36,935 | $51,599 | $2,054 |
Union Pacific | UNP | Industrials | $2,956 | $642 | $5,273 | $10,546 | $26,776 | $37,152 | $2,693 |
Goldman Sachs Group | GS | Financials | $2,732 | $2,166 | $6,832 | $4,552 | $32,310 | $57,806 | $1,967 |
Charter Communications | CHTR | Communication Services | $2,352 | $2,305 | $8,285 | $4,722 | $26,923 | $27,723 | $0 |
Biogen | BIIB | Health Care | $2,220 | $2,093 | $7,433 | $4,758 | $19,807 | $24,076 | $0 |
Facebook, | FB | Communication Services | $1,940 | $1,923 | $7,354 | $14,606 | $29,794 | $33,619 | $0 |
Honeywell International | HON | Industrials | $1,923 | $750 | $5,573 | $3,810 | $16,812 | $20,069 | $2,572 |
Linde plc | LIN | Materials | $1,828 | $724 | $3,761 | $727 | $5,218 | $8,962 | $2,068 |
Morgan Stanley | MS | Financials | $1,782 | $1,507 | $6,091 | $5,343 | $23,461 | $27,034 | $2,823 |
Top 20 | $92,846 | $81,510 | $323,363 | $287,060 | $1,049,905 | $1,413,063 | $103,932 | ||
S&P 500 | $198,722 | $181,583 | $721,649 | $823,168 | $3,217,673 | $5,438,217 | $514,910 | ||
Top 20 % of S&P 500 | 46.72% | 44.89% | 44.81% | 34.87% | 32.63% | 25.98% | 20.18% | ||
Gross values are not adjusted for float | |||||||||
S&P Dow Jones Indices | |||||
S&P 500 20 Largest Quarterly Buybacks, $ Millions, as of Q1 2020; Apple added at #7 | |||||
$ MILLIONS | QUARTER | COMPANY | SECTOR | ||
$23,811 | Q1 2019 | Apple | Information Technology | 1 | |
$22,908 | Q1 2018 | Apple | Information Technology | 2 | |
$22,085 | Q4 2019 | Apple | Information Technology | 3 | |
$21,860 | Q2 2018 | Apple | Information Technology | 4 | |
$21,162 | Q2 2006 | QUALCOMM | Information Technology | 5 | |
$19,364 | Q3 2018 | Apple | Information Technology | 6 | |
$18,761 | Q1 2020 | Apple | Information Technology | 7 | |
$18,154 | Q2 2019 | Apple | Information Technology | 8 | |
$18,036 | Q1 2014 | Apple | Information Technology | 9 | |
$17,635 | Q3 2019 | Apple | Information Technology | 10 | |
$17,319 | Q3 2014 | Apple | Information Technology | 11 | |
$16,413 | Q2 2013 | Apple | Information Technology | 12 | |
$15,707 | Q3 2007 | Interna'l Bus Machines | Information Technology | 13 | |
$13,420 | Q3 2015 | Apple | Information Technology | 14 | |
$12,852 | Q4 2013 | Johnson & Johnson | Healthcare | 15 | |
$12,318 | Q4 2016 | Allergan plc (AGN) | Healthcare | 16 | |
$12,183 | Q2 2012 | Johnson & Johnson | Healthcare | 17 | |
$11,480 | Q4 2016 | Apple | Information Technology | 18 | |
$11,133 | Q4 2017 | Apple | Information Technology | 19 | |
$10,776 | Q2 2016 | Apple | Information Technology | 20 | |
S&P Dow Jones Indices | ||||
S&P 500 Q1 2020 Buyback Report | ||||
SECTOR | DIVIDEND | BUYBACK | COMBINED | |
YIELD | YIELD | YIELD | ||
Consumer Discretionary | 0.89% | 2.51% | 3.40% | |
Consumer Staples | 3.90% | 1.66% | 5.56% | |
Energy | 5.60% | 2.48% | 8.07% | |
Financials | 3.06% | 6.79% | 9.84% | |
HealthCare | 1.91% | 2.06% | 3.97% | |
Industrials | 2.14% | 3.08% | 5.22% | |
Information Technology | 1.32% | 3.26% | 4.58% | |
Materials | 2.56% | 2.46% | 5.02% | |
Real Estate | 3.35% | 0.44% | 3.79% | |
Communications Services | 1.42% | 2.25% | 3.67% | |
Utilities | 3.53% | 0.27% | 3.80% | |
S&P 500 | 2.10% | 2.92% | 5.02% | |
Uses full values (unadjusted for float) | ||||
Dividends based on indicated; buybacks based on the last 12-months ending Q1,'20 | ||||
Share Count Changes | ||
(Y/Y diluted shares used for EPS) | >=4% | <=-4% |
Q1 2020 | 8.05% | 19.32% |
Q4 2019 | 7.63% | 20.68% |
Q3 2019 | 8.62% | 22.85% |
Q2 2019 | 7.98% | 24.15% |
Q1 2019 | 8.03% | 24.90% |
Q4 2018 | 8.45% | 18.71% |
Q3 2018 | 6.43% | 17.67% |
Q2 2018 | 6.20% | 15.60% |
Q1 2018 | 7.01% | 13.63% |
Q4 2017 | 6.83% | 15.06% |
Q3 2017 | 8.62% | 14.23% |
Q2 2017 | 10.00% | 14.00% |
Q1 2017 | 12.00% | 14.80% |
ABOUT S&P DOW JONES INDICES
S&P Dow Jones Indices is the largest global resource for essential index-based concepts, data and research, and home to iconic financial market indicators, such as the S&P 500® and the Dow Jones Industrial Average®. More assets are invested in products based on our indices than products based on indices from any other provider in the world. Since Charles Dow invented the first index in 1884, S&P DJI has been innovating and developing indices across the spectrum of asset classes helping to define the way investors measure and trade the markets.
S&P Dow Jones Indices is a division of S&P Global (NYSE: SPGI), which provides essential intelligence for individuals, companies, and governments to make decisions with confidence. For more information, visit: www.spdji.com.
SOURCE S&P Dow Jones Indices
