Press Releases
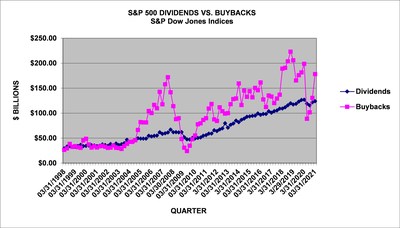
NEW YORK, June 15, 2021 /PRNewswire/ -- S&P Dow Jones Indices ("S&P DJI") announced today that preliminary Q1 2021 S&P 500® stock buybacks, or share repurchases, were $178.1 billion, a 36.5% increase from Q4 2020's $130.5 billion, and 100.9% above the recent Q2 2020 low of $88.7 billion. The year-over-year pre-COVID rate was 10.4% less than Q1 2020's $198.7 billion expenditure. For the 12-month March 2021 period, buybacks were $499.1 billion, down 30.8% from $721.6 billion in the 12-month March 2020 period.
Historical data on S&P 500 buybacks are available at www.spdji.com/indices/equity/sp-500.
Key Takeaways:
- Q1 2021 share repurchases were $178.1 billion, rebounding 36.5% from Q4 2020's $130.5 billion expenditure, up 100.9% from the Q2 2020 recent low of $88.7 billion, but down 10.4% year-over-year from the pre-COVID Q1 2020 $198.7 billion.
- 335 companies reported buybacks of at least $5 million for the quarter, up from 244 in Q4 2020, 190 in Q3 2020, 170 in Q2 2020 and down from 373 in Q1 2020.
- Buybacks remained top heavy but significantly less so, with the top 20 issues accounting for 53.3% of Q1 2021 buybacks, down from 66.3% in Q4 2020, 77.4% in Q3 2020, and 87.2% in Q2 2020, but still up from the historical pre-COVID historical average of 44.5%.
- For the 12-month March 2021 period, buybacks were $499.1 billion, a 30.8% decrease from the prior 12-month March 2020 period of $721.6 billion.
- Buybacks are expected to continue at a higher level in 2021 as big banks, via Fed approval for the second half of the year, have returned to the buyback market, and more companies are expected to expand their buybacks to discretionary purchases used to reduce share count and increase earnings-per-share.
- 5.9% of companies reduced share counts by at least 4% year-over-year, down from Q4 2020's 6.0%, and down significantly from Q1 2020's 19.6% (the recent high was in Q1 2016, at 28.2%).
- S&P 500 Q1 2021 dividends increased 1.9% to $123.9 billion from Q4 2020's $121.6 billion and were 2.4% less than the record $127.0 billion in Q1 2020. For the 12-month March 2021 period, dividends were $480.1 billion, down 3.0% on an aggregate basis from prior period's $495.1 billion.
- Total shareholder return of buybacks and dividends in Q1 2021 was $302.0 billion, up 19.8% from Q4 2020's $252.1 billion and down 7.3% from Q1 2020's $325.7 billion (Q4 2018 holds the record, at $342.8 billion).
- Total shareholder return for the 12-months March 2021 declined to $0.98 trillion from 12-month March 2020's $1.22 trillion.
"Companies almost fully returned to the buyback market in Q1 2021 after their Q2 2020 COVID inspired departure, as 335 issues did significant open-market purchases, up from 244 last quarter and 170 in Q2 2020. Given the strong and expected record level cash-flow from Q1 2021, the full return to pre-COVID levels is expected later in the year," said Howard Silverblatt, Senior Index Analyst at S&P Dow Jones Indices.
Remainder of 2021 Outlook:
Silverblatt added, "Companies are expected to fully cover their employee stock options via buybacks, as discretionary buybacks, which reduce share count and increase earnings-per-share, are expected to increase to near record levels by year-end, subject to the continuance of consumer spending which produced a record Q1 earnings series."
Q1 2021 GICS® Sector Analysis:
Information Technology continued to lead and dominate in buybacks, but at a reduced rate, as Financials re-entered the buyback market. For Q1 2021 IT's share declined to 31.6% of all S&P 500 buybacks from Q4 2020's 42.9%, as their expenditure ticked up (0.5%) to $56.4 billion from the prior quarter's $56.1 billion, but was shy (-4.7%) of the Q1 2020 expenditure of $59.1 billion. For the 12-mont March 2021 period, the sector spent $199.1 billion, representing 39.9% of all S&P buybacks, down from the prior 12-month period of $216.0 billion, which represented 29.9% of all buybacks.
Financial buybacks returned, spending $35.4 billion in Q1 2021, representing 19.9% of all buybacks, up 160% from the Q4 2020 $13.6 billion, which accounted for 10.4% of the buybacks, and was 24.1% lower than the pre-COVID Q1 2020 $46.6 billion expenditure (23.5% of all buybacks). For the 12-month period, the group spent $69.4 billion (with Berkshire Hathaway accounting for $29.5 billion, or 42.5%), down from the prior period of $182.8 billion (when Berkshire spent $5.0 billion, or 2.7% of all Financial buybacks).
Health Care increased 35.8% to $20.4 billion, from the prior quarter's $15.0 billion and a tick below the Q1 2020 $20.8 billion. As a percentage of all buybacks, Health Care remains stable, representing 11.4% of all buybacks, compared to last quarters' 10.5%, as the 12-month period was 10.8% and the prior 12-month's 10.2%.
Issues:
The five issues with the highest total buybacks for Q1 2021 are:
- Apple (AAPL) continued to be the poster-child for buybacks, again spending more than any other issue, as it spent $18.8 billion in Q1 2021 (down from the Q4 2020 $27.6 billion), which ranked as the eighth largest expenditure in index history, as Apple held 14 of the top 15 record quarters (QUALCOM holds #6, posted in Q3 2018, with $21.2 billion). For the 12-month period, Apple has spent $81.6 billion on buybacks, up from the prior period's $76.6 billion. Over the five-year period, they have spent $319.2 billion and $441.9 billion over the ten-year period.
- Alphabet (GOOG/L), was next: $11.4 billion for Q1 2021, up from $7.9 billion in Q4 2020; the 12-month March 2021 expenditure was $34.0 billion versus $23.9 billion for the 12-months ending March 2020.
- Microsoft (MSFT): $6.9 billion for Q1 2021, up from $6.5 billion in Q4 2020; for the 12-month period it was $26.0 billion versus $21.8 billion.
- Berkshire Hathaway (BRK.B): $6.6 billion for Q1 2021, down from the $9.0 billion spent in Q4 2020; for the 12 months it was $29.5 billion versus $5.0 billion.
- Facebook (FB): $5.0 billion for Q1 2021, up from $3.0 billion in Q4 2020; for the 12-months they spent $12.9 billion versus $7.4 billion.
For more information about S&P Dow Jones Indices, please visit www.spdji.com.
S&P Dow Jones Indices | ||||||||
S&P 500, $ U.S. BILLIONS | (preliminary in bold) | |||||||
PERIOD | MARKET | OPERATING | AS REPORTED | DIVIDEND & | ||||
VALUE | EARNINGS | EARNINGS | DIVIDENDS | BUYBACKS | DIVIDEND | BUYBACK | BUYBACK | |
$ BILLIONS | $ BILLIONS | $ BILLIONS | $ BILLIONS | $ BILLIONS | YIELD | YIELD | YIELD | |
12 Mo Mar,21 Prelim. | $33,619.36 | $1,259.10 | $1,074.74 | $480.11 | $499.11 | 1.43% | 1.48% | 2.91% |
12 Mo Mar,20 | $21,424.38 | $1,149.84 | $964.88 | $495.13 | $721.65 | 2.31% | 3.37% | 5.68% |
2020 | $31,658.70 | $1,019.04 | $784.12 | $480.40 | $519.69 | 1.52% | 1.64% | 3.16% |
2019 | $26,759.69 | $1,304.76 | $1,158.22 | $485.48 | $728.74 | 1.81% | 2.72% | 4.54% |
2018 | $21,026.90 | $1,281.66 | $1,119.43 | $456.31 | $806.41 | 2.17% | 3.84% | 6.01% |
3/31/2021 Prelim. | $33,619 | $401.70 | $389.01 | $123.91 | $178.13 | 1.43% | 1.48% | 2.91% |
12/31/2020 | $31,659 | $321.81 | $265.00 | $121.62 | $130.52 | 1.53% | 1.64% | 3.17% |
9/30/2020 | $27,868 | $314.06 | $273.29 | $115.54 | $101.79 | 1.75% | 2.05% | 3.80% |
6/30/2020 | $25,637 | $221.53 | $147.44 | $119.04 | $88.66 | 1.93% | 2.52% | 4.45% |
3/31/2020 | $21,424 | $161.64 | $98.48 | $126.98 | $198.72 | 2.31% | 3.37% | 5.68% |
12/31/2019 | $26,760 | $324.52 | $294.29 | $126.35 | $181.58 | 1.81% | 2.72% | 4.54% |
9/30/2019 | $24,707 | $330.42 | $282.12 | $123.12 | $175.89 | 1.94% | 3.12% | 5.06% |
6/28/2019 | $24,423 | $333.26 | $290.00 | $118.68 | $165.46 | 1.93% | 3.27% | 5.20% |
3/29/2019 | $23,619 | $316.56 | $291.82 | $117.33 | $205.81 | 1.97% | 3.49% | 5.45% |
12/31/2018 | $21,027 | $293.82 | $242.91 | $119.81 | $222.98 | 2.17% | 3.84% | 6.01% |
9/30/2018 | $24,579 | $349.04 | $306.70 | $115.72 | $203.76 | 1.81% | 2.93% | 4.75% |
6/30/2018 | $23,036 | $327.53 | $288.55 | $111.60 | $190.62 | 1.89% | 2.80% | 4.69% |
3/29/2018 | $22,496 | $311.26 | $281.28 | $109.18 | $189.05 | 1.90% | 2.56% | 4.46% |
12/29/2017 | $22,821 | $288.93 | $230.12 | $109.46 | $136.97 | 1.84% | 2.28% | 4.12% |
9/29/2017 | $21,579 | $268.35 | $243.68 | $105.45 | $129.17 | 1.92% | 2.40% | 4.32% |
6/30/2017 | $20,762 | $261.39 | $231.40 | $104.01 | $120.11 | 1.96% | 2.41% | 4.37% |
3/31/2017 | $20,276 | $247.32 | $235.65 | $100.86 | $133.15 | 1.98% | 2.51% | 4.49% |
S&P Dow Jones Indices | |||||||||
S&P 500 SECTOR BUYBACKS | |||||||||
SECTOR $ MILLIONS | Q1,'21 | Q4,'20 | Q1,'20 | 12MoMar,'21 | 12MoMar,'20 | 5-YEARS | 10-YEARS | Q4,'18 | Q2,'20 |
(high) | (recent low) | ||||||||
Consumer Discretionary | $15,918 | $8,863 | $16,087 | $29,346 | $66,843 | $347,010 | $736,551 | $25,652 | $1,317 |
Consumer Staples | $9,631 | $8,720 | $5,278 | $24,095 | $29,330 | $179,224 | $404,238 | $9,588 | $1,514 |
Energy | $488 | $334 | $3,861 | $947 | $18,318 | $70,431 | $241,021 | $8,698 | $60 |
Financials | $35,389 | $13,601 | $46,637 | $69,437 | $182,477 | $646,931 | $992,474 | $45,641 | $8,346 |
Healthcare | $20,394 | $15,018 | $20,807 | $53,669 | $73,922 | $388,975 | $727,643 | $31,336 | $10,706 |
Industrials | $13,545 | $7,235 | $20,736 | $26,039 | $62,102 | $289,302 | $580,512 | $23,026 | $1,816 |
Information Technology | $56,360 | $56,085 | $59,138 | $199,072 | $215,999 | $965,207 | $1,568,079 | $61,298 | $36,900 |
Materials | $4,065 | $2,593 | $4,551 | $7,627 | $15,488 | $54,128 | $121,904 | $5,857 | $184 |
Real Estate | $427 | $732 | $1,320 | $1,768 | $3,142 | $13,690 | $13,690 | $1,480 | $204 |
Communication Services | $21,781 | $16,581 | $20,002 | $83,226 | $51,848 | $162,658 | $199,143 | $9,556 | $27,548 |
Utilities | $135 | $831 | $303 | $3,948 | $2,180 | $9,878 | $18,737 | $850 | $67 |
TOTAL | $178,133 | $130,592 | $198,722 | $499,173 | $721,649 | $3,127,435 | $5,603,991 | $222,980 | $88,661 |
SECTOR BUYBACK MAKEUP % | Q1,'21 | Q4,'20 | Q1,'20 | 12MoMar,'21 | 12MoMar,'20 | 5-YEARS | 10-YEARS | Q4,'18 | Q2,'20 |
Consumer Discretionary | 8.94% | 6.79% | 8.10% | 5.88% | 9.26% | 11.10% | 13.14% | 11.50% | 1.49% |
Consumer Staples | 5.41% | 6.68% | 2.66% | 4.83% | 4.06% | 5.73% | 7.21% | 4.30% | 1.71% |
Energy | 0.27% | 0.26% | 1.94% | 0.19% | 2.54% | 2.25% | 4.30% | 3.90% | 0.07% |
Financials | 19.87% | 10.41% | 23.47% | 13.91% | 25.29% | 20.69% | 17.71% | 20.47% | 9.41% |
Healthcare | 11.45% | 11.50% | 10.47% | 10.75% | 10.24% | 12.44% | 12.98% | 14.05% | 12.07% |
Industrials | 7.60% | 5.54% | 10.43% | 5.22% | 8.61% | 9.25% | 10.36% | 10.33% | 2.05% |
Information Technology | 31.64% | 42.95% | 29.76% | 39.88% | 29.93% | 30.86% | 27.98% | 27.49% | 41.62% |
Materials | 2.28% | 1.99% | 2.29% | 1.53% | 2.15% | 1.73% | 2.18% | 2.63% | 0.21% |
Real Estate | 0.24% | 0.56% | 0.66% | 0.35% | 0.44% | 0.44% | 0.24% | 0.66% | 0.23% |
Communication Services | 12.23% | 12.70% | 10.07% | 16.67% | 7.18% | 5.20% | 3.55% | 4.29% | 31.07% |
Utilities | 0.08% | 0.64% | 0.15% | 0.79% | 0.30% | 0.32% | 0.33% | 0.38% | 0.08% |
TOTAL | 100.00% | 100.00% | 100.00% | 100.00% | 100.00% | 100.00% | 100.00% | 100.00% | 100.00% |
S&P Dow Jones Indices | ||||||||||
S&P 500 20 LARGEST Q1 2021 BUYBACKS, $ MILLIONS | ||||||||||
Company | Ticker | Sector | Q1 2021 | Q4 2020 | Q1 20209 | 12-Months | 12-Months | 5-Year | 10-Year | Indicated |
Buybacks | Buybacks | Buybacks | Mar,'21 | Mar,'20 | Buybacks | Buybacks | Dividend | |||
$ Million | $ Million | $ Million | $ Million | $ Million | $ Million | $ Million | $ Million | |||
Apple | AAPL | Information Technology | $18,847 | $27,636 | $18,761 | $81,629 | $76,635 | $319,239 | $441,860 | $15,717 |
Alphabet | GOOGL | Communication Services | $11,395 | $7,904 | $8,496 | $34,048 | $23,867 | $76,456 | $80,450 | $0 |
Microsoft | MSFT | Information Technology | $6,930 | $6,535 | $7,059 | $25,999 | $21,810 | $88,905 | $134,601 | $16,895 |
Berkshire Hathaway | BRK.B | Financials | $6,580 | $8,994 | $1,741 | $29,545 | $5,006 | $37,482 | $37,549 | $0 |
FB | Communication Services | $5,016 | $3,049 | $1,940 | $12,912 | $7,354 | $42,706 | $46,531 | $0 | |
JPMorgan Chase | JPM | Financials | $4,806 | $0 | $6,517 | $4,806 | $25,427 | $78,103 | $105,385 | $10,985 |
Oracle | ORCL | Information Technology | $4,073 | $4,059 | $4,004 | $18,901 | $20,860 | $87,780 | $131,531 | $5,982 |
Home Depot | HD | Consumer Discretionary | $3,788 | $0 | $791 | $3,788 | $6,388 | $35,230 | $65,086 | $7,106 |
Charter Communications | CHTR | Communication Services | $3,652 | $4,349 | $2,352 | $12,517 | $8,285 | $39,402 | $40,027 | $0 |
Goldman Sachs Group | GS | Financials | $3,638 | $1 | $2,732 | $3,664 | $6,832 | $30,645 | $58,075 | $1,720 |
Bank of America | BAC | Financials | $3,470 | $263 | $6,362 | $4,133 | $28,243 | $75,659 | $83,928 | $7,064 |
Lowe's Companies | LOW | Consumer Discretionary | $3,038 | $3,443 | $966 | $7,043 | $4,453 | $20,893 | $39,985 | $2,339 |
Procter & Gamble | PG | Consumer Staples | $3,001 | $3,008 | $901 | $8,009 | $9,155 | $31,124 | $56,399 | $8,569 |
Walmart | WMT | Consumer Staples | $2,809 | $1,439 | $723 | $4,711 | $4,305 | $32,420 | $55,666 | $12,703 |
Cigna | CI | Health Care | $2,794 | $1,690 | $956 | $5,880 | $2,481 | $11,890 | $15,596 | $1,407 |
Morgan Stanley | MS | Financials | $2,582 | $50 | $1,782 | $2,690 | $6,091 | $23,241 | $29,396 | $3,283 |
Intel | INTC | Information Technology | $2,301 | $2,000 | $4,229 | $12,301 | $15,322 | $46,649 | $79,956 | $5,648 |
PayPal Holdings | PYPL | Information Technology | $2,186 | $323 | $1,202 | $3,140 | $2,052 | $11,870 | $12,510 | $0 |
Northrop Grumman | NOC | Industrials | $2,030 | $0 | $407 | $2,179 | $1,095 | $6,509 | $18,933 | $1,126 |
Thermo Fisher Scientific | TMO | Health Care | $2,000 | $0 | $1,500 | $2,000 | $2,257 | $6,510 | $10,050 | $410 |
Top 20 | $94,936 | $74,743 | $73,421 | $279,895 | $277,918 | ######## | ######## | ####### | ||
S&P 500 | $178,133 | $130,525 | $101,786 | $499,105 | $721,649 | ######## | ######## | ####### | ||
Top 20 % of S&P 500 | 53.30% | 57.26% | 72.13% | 56.08% | 38.51% | 35.26% | 27.54% | 18.72% | ||
Gross values are not adjusted for float | ||||||||||
S&P Dow Jones Indices | ||||
S&P 500 Q1 2021 Buyback Report | ||||
SECTOR | DIVIDEND | BUYBACK | COMBINED | |
YIELD | YIELD | YIELD | ||
Consumer Discretionary | 0.67% | 0.69% | 1.36% | |
Consumer Staples | 3.33% | 1.11% | 4.44% | |
Energy | 4.07% | 0.08% | 4.16% | |
Financials | 1.78% | 1.63% | 3.41% | |
HealthCare | 1.68% | 1.17% | 2.85% | |
Industrials | 1.44% | 0.82% | 2.26% | |
Information Technology | 0.98% | 2.11% | 3.09% | |
Materials | 1.85% | 0.77% | 2.62% | |
Real Estate | 2.55% | 0.15% | 2.70% | |
Communications Services | 1.02% | 2.55% | 3.57% | |
Utilities | 3.18% | 0.43% | 3.62% | |
S&P 500 | 1.54% | 1.42% | 2.96% | |
Uses full values (unadjusted for float) | ||||
Dividends based on indicated; buybacks based on the last 12-months ending Q1,'21 | ||||
S&P Dow Jones Indices | ||
Share Count Changes | ||
(Y/Y diluted shares used for EPS) | >=4% | <=-4% |
Q1 2021 | 10.51% | 5.86% |
Q4 2020 | 9.02% | 6.01% |
Q3 2020 | 8.62% | 9.62% |
Q2 2020 | 8.60% | 17.80% |
Q1 2020 | 8.00% | 19.60% |
Q4 2019 | 7.63% | 20.68% |
Q3 2019 | 8.62% | 22.85% |
Q2 2019 | 7.98% | 24.15% |
Q1 2019 | 8.03% | 24.90% |
Q4 2018 | 8.45% | 18.71% |
Q3 2018 | 6.43% | 17.67% |
Q2 2018 | 6.20% | 15.60% |
Q1 2018 | 7.01% | 13.63% |
ABOUT S&P DOW JONES INDICES
S&P Dow Jones Indices is the largest global resource for essential index-based concepts, data and research, and home to iconic financial market indicators, such as the S&P 500® and the Dow Jones Industrial Average®. More assets are invested in products based on our indices than products based on indices from any other provider in the world. Since Charles Dow invented the first index in 1884, S&P DJI has been innovating and developing indices across the spectrum of asset classes helping to define the way investors measure and trade the markets.
S&P Dow Jones Indices is a division of S&P Global (NYSE: SPGI), which provides essential intelligence for individuals, companies, and governments to make decisions with confidence. For more information, visit: www.spdji.com.
SOURCE S&P Dow Jones Indices
